Automatic Plant Watering System
Jonathan Pfeifer (jap482)
Mustapha Toureg (mt633
Demonstration Video
Introduction:
For our final project we built an autonomous plant watering system that can take care of your plants while you are away. In addition to simply watering the plants, a suite of sensors takes measurements of the plants surroundings so that you can keep track of the environment over time and ensure that it is the proper one for growing a plant. The main idea behind the autonomous system is to allow taking care of your plants even while you are away. And if you are away you want to be making sure that the system is still operating as expected. With our system, you can check in on your plant remotely through any web browser and watch a live feed of the plant to make sure it still safe. You can also watch a timelapse of the plant growth by checking in remotely.
 |
|---|
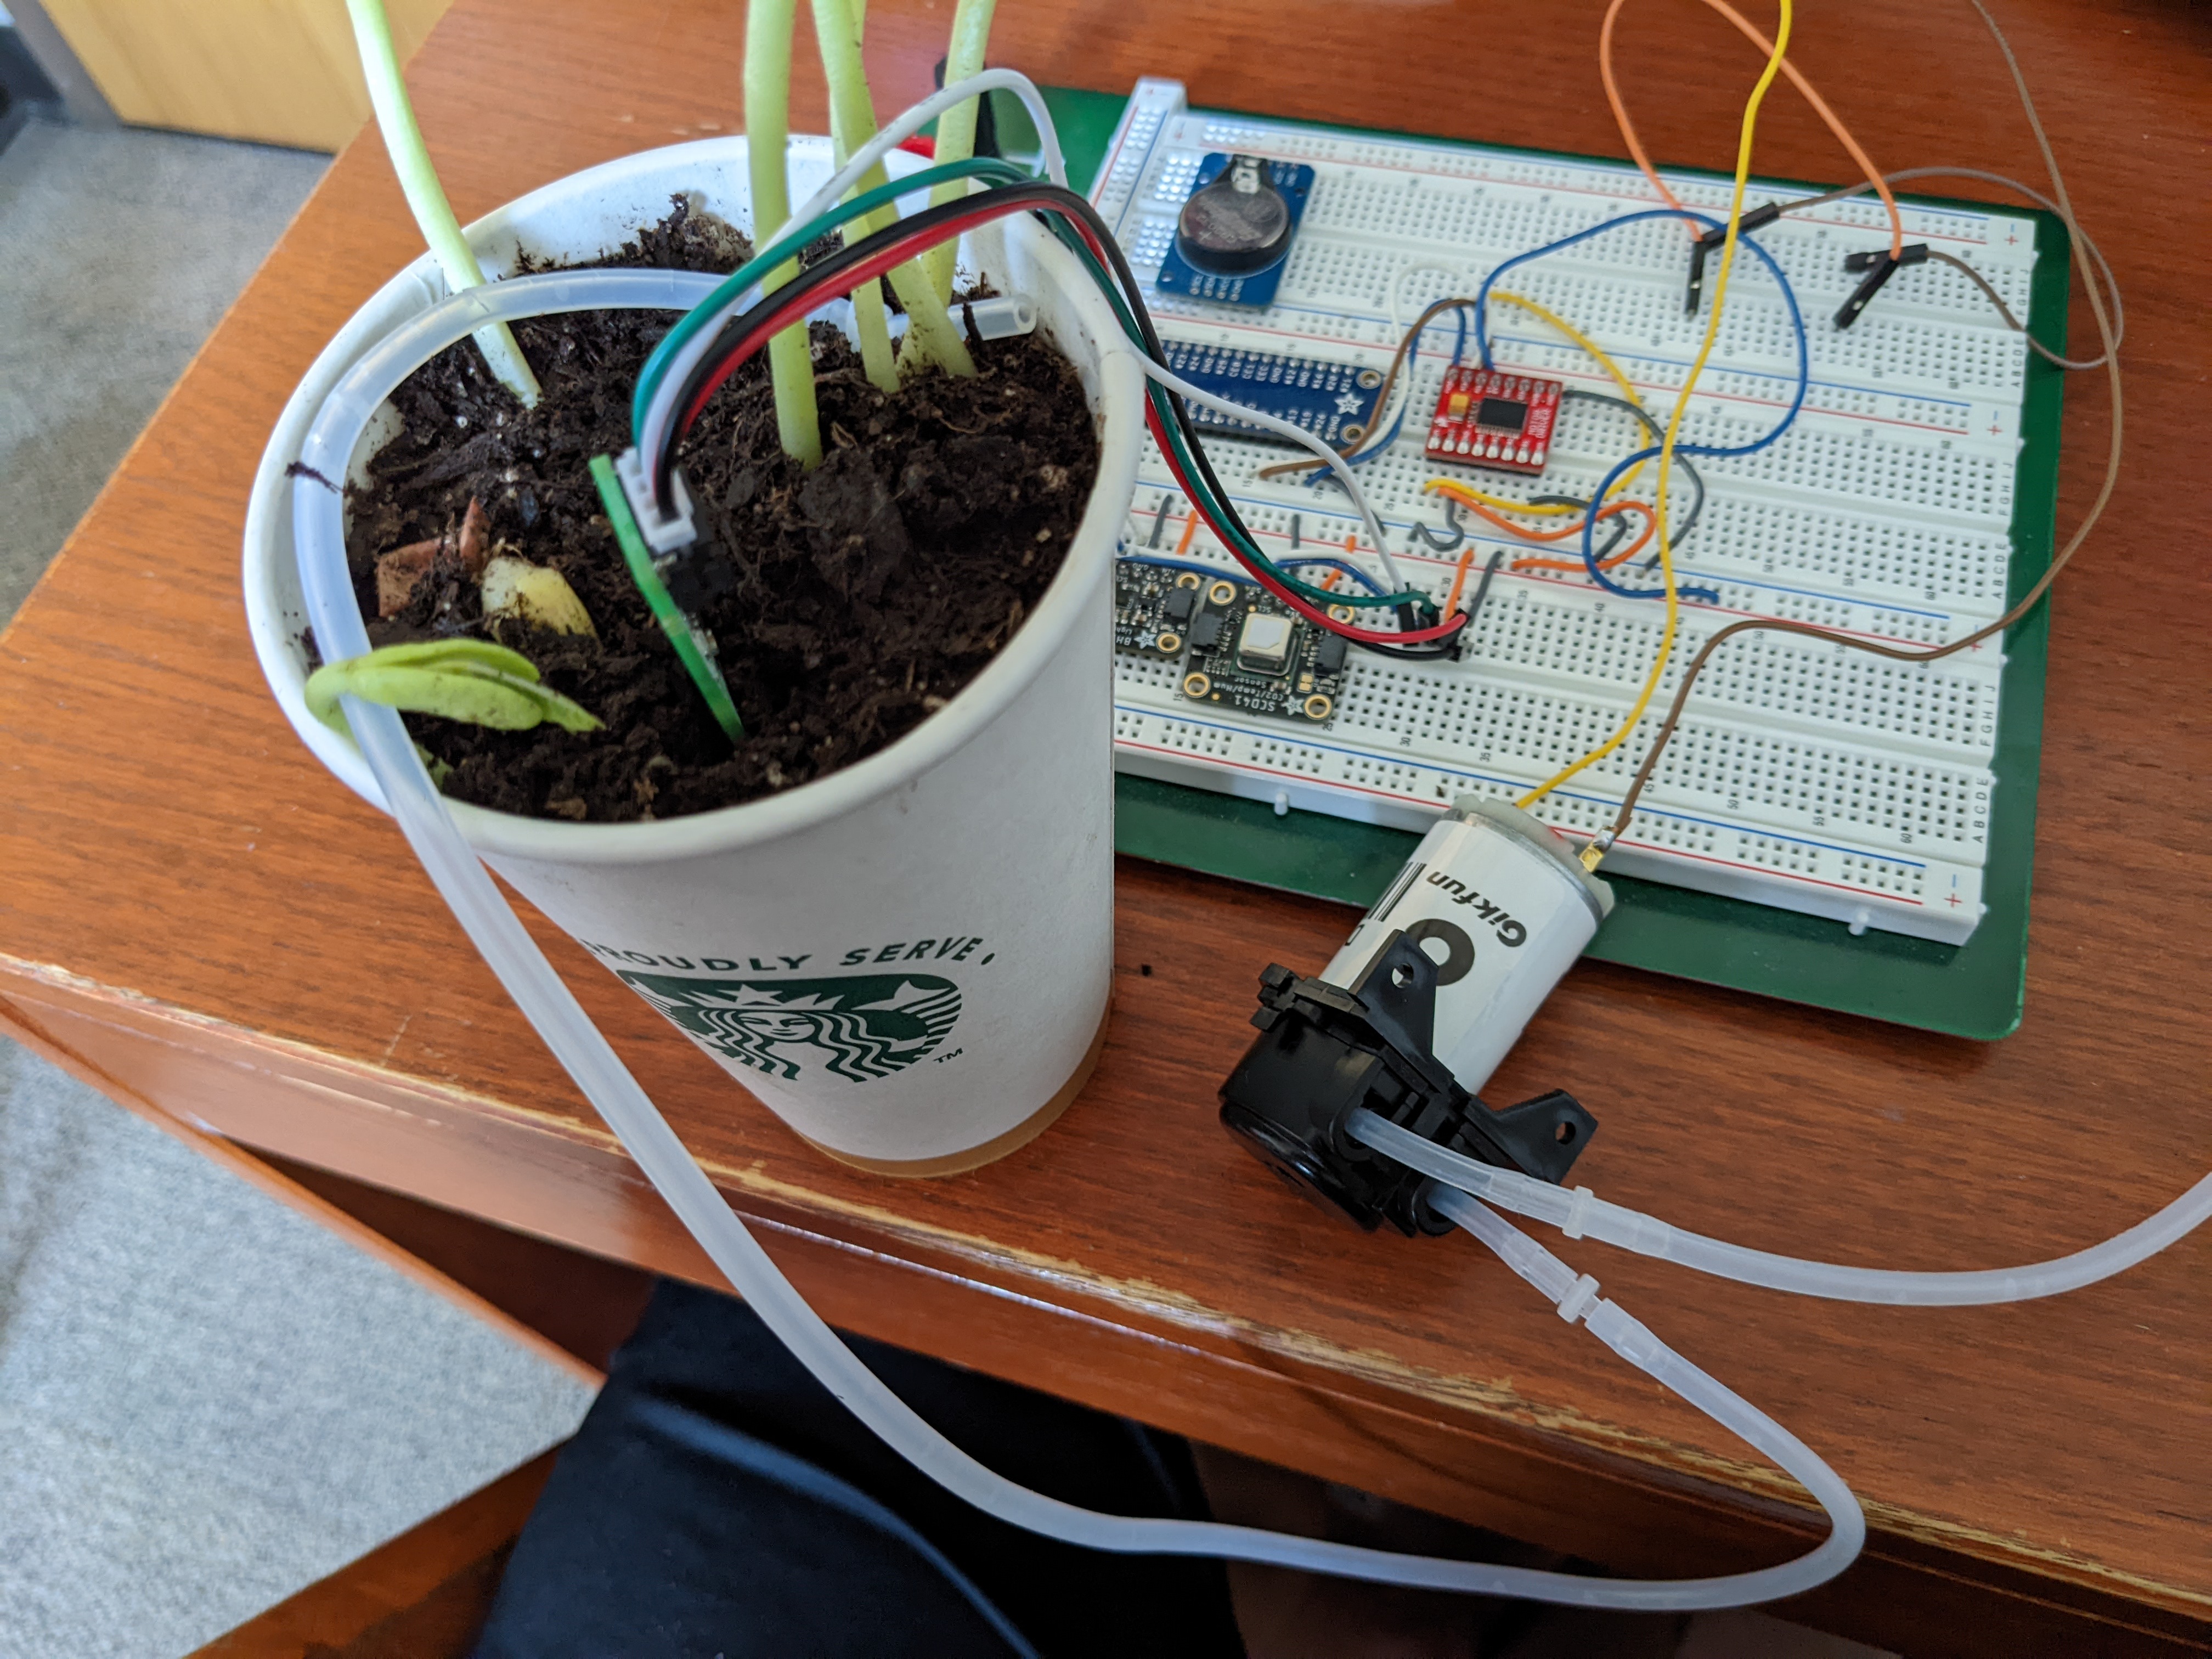
| Figure 1: This is an image of the system. The sensors are on the breadboard, and pole beans were used as the demo plant. |
System Design and Testing:
The system design can be broken down into several separate modules. The first is the sensor module which utilizes the sensors to determine soil moisture and conditions and doses water to the plant when needed. The second is the user interface which utilizes the PiTFT to display current sensor measurements and plot past sensor data for readouts. The last is the online connections and functions that the RPi uses for the remote connection.
 |
|---|
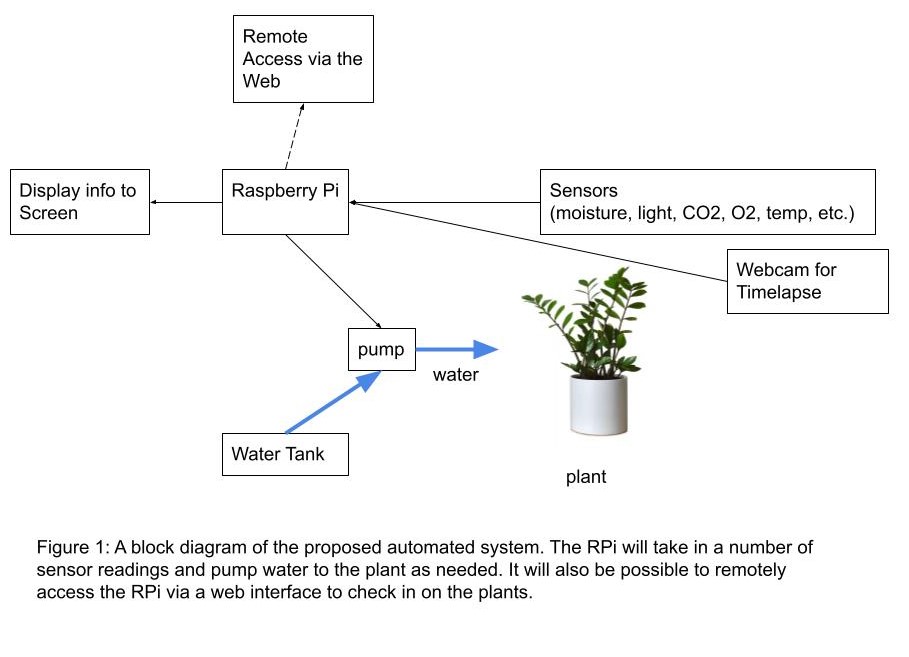
| Figure 2: A module level diagram of the plant watering system. |
Sensors and Pumping Water:
 |
|---|
| Space |
Hardware Design:
The system can take 5 different kinds of measurements. The most important one is moisture in the plant soil. We decided to use an Adafruit capacitive moisture sensor.
 |
|---|
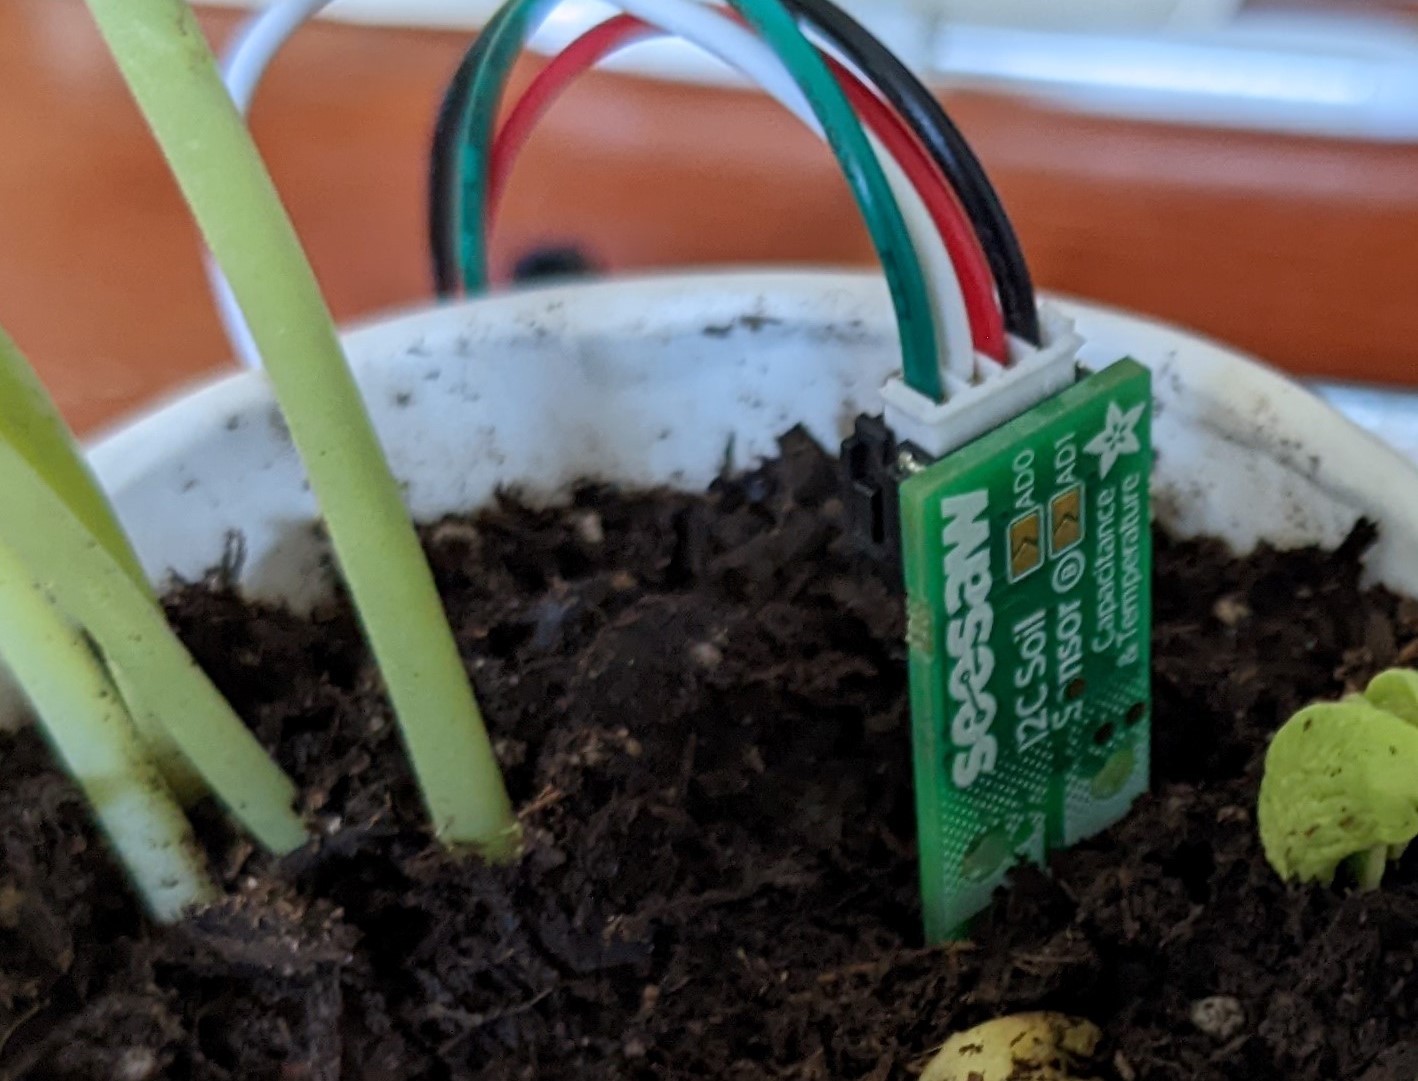
| Figure 4: This is the Adafruit capacitive soil moisture sensor used for this project. |
Capacitive sensors are more robust and can survive longer in soil compared to resistive sensors. It returns a number between 200 and 2000 which relates to the wetness of the soil.
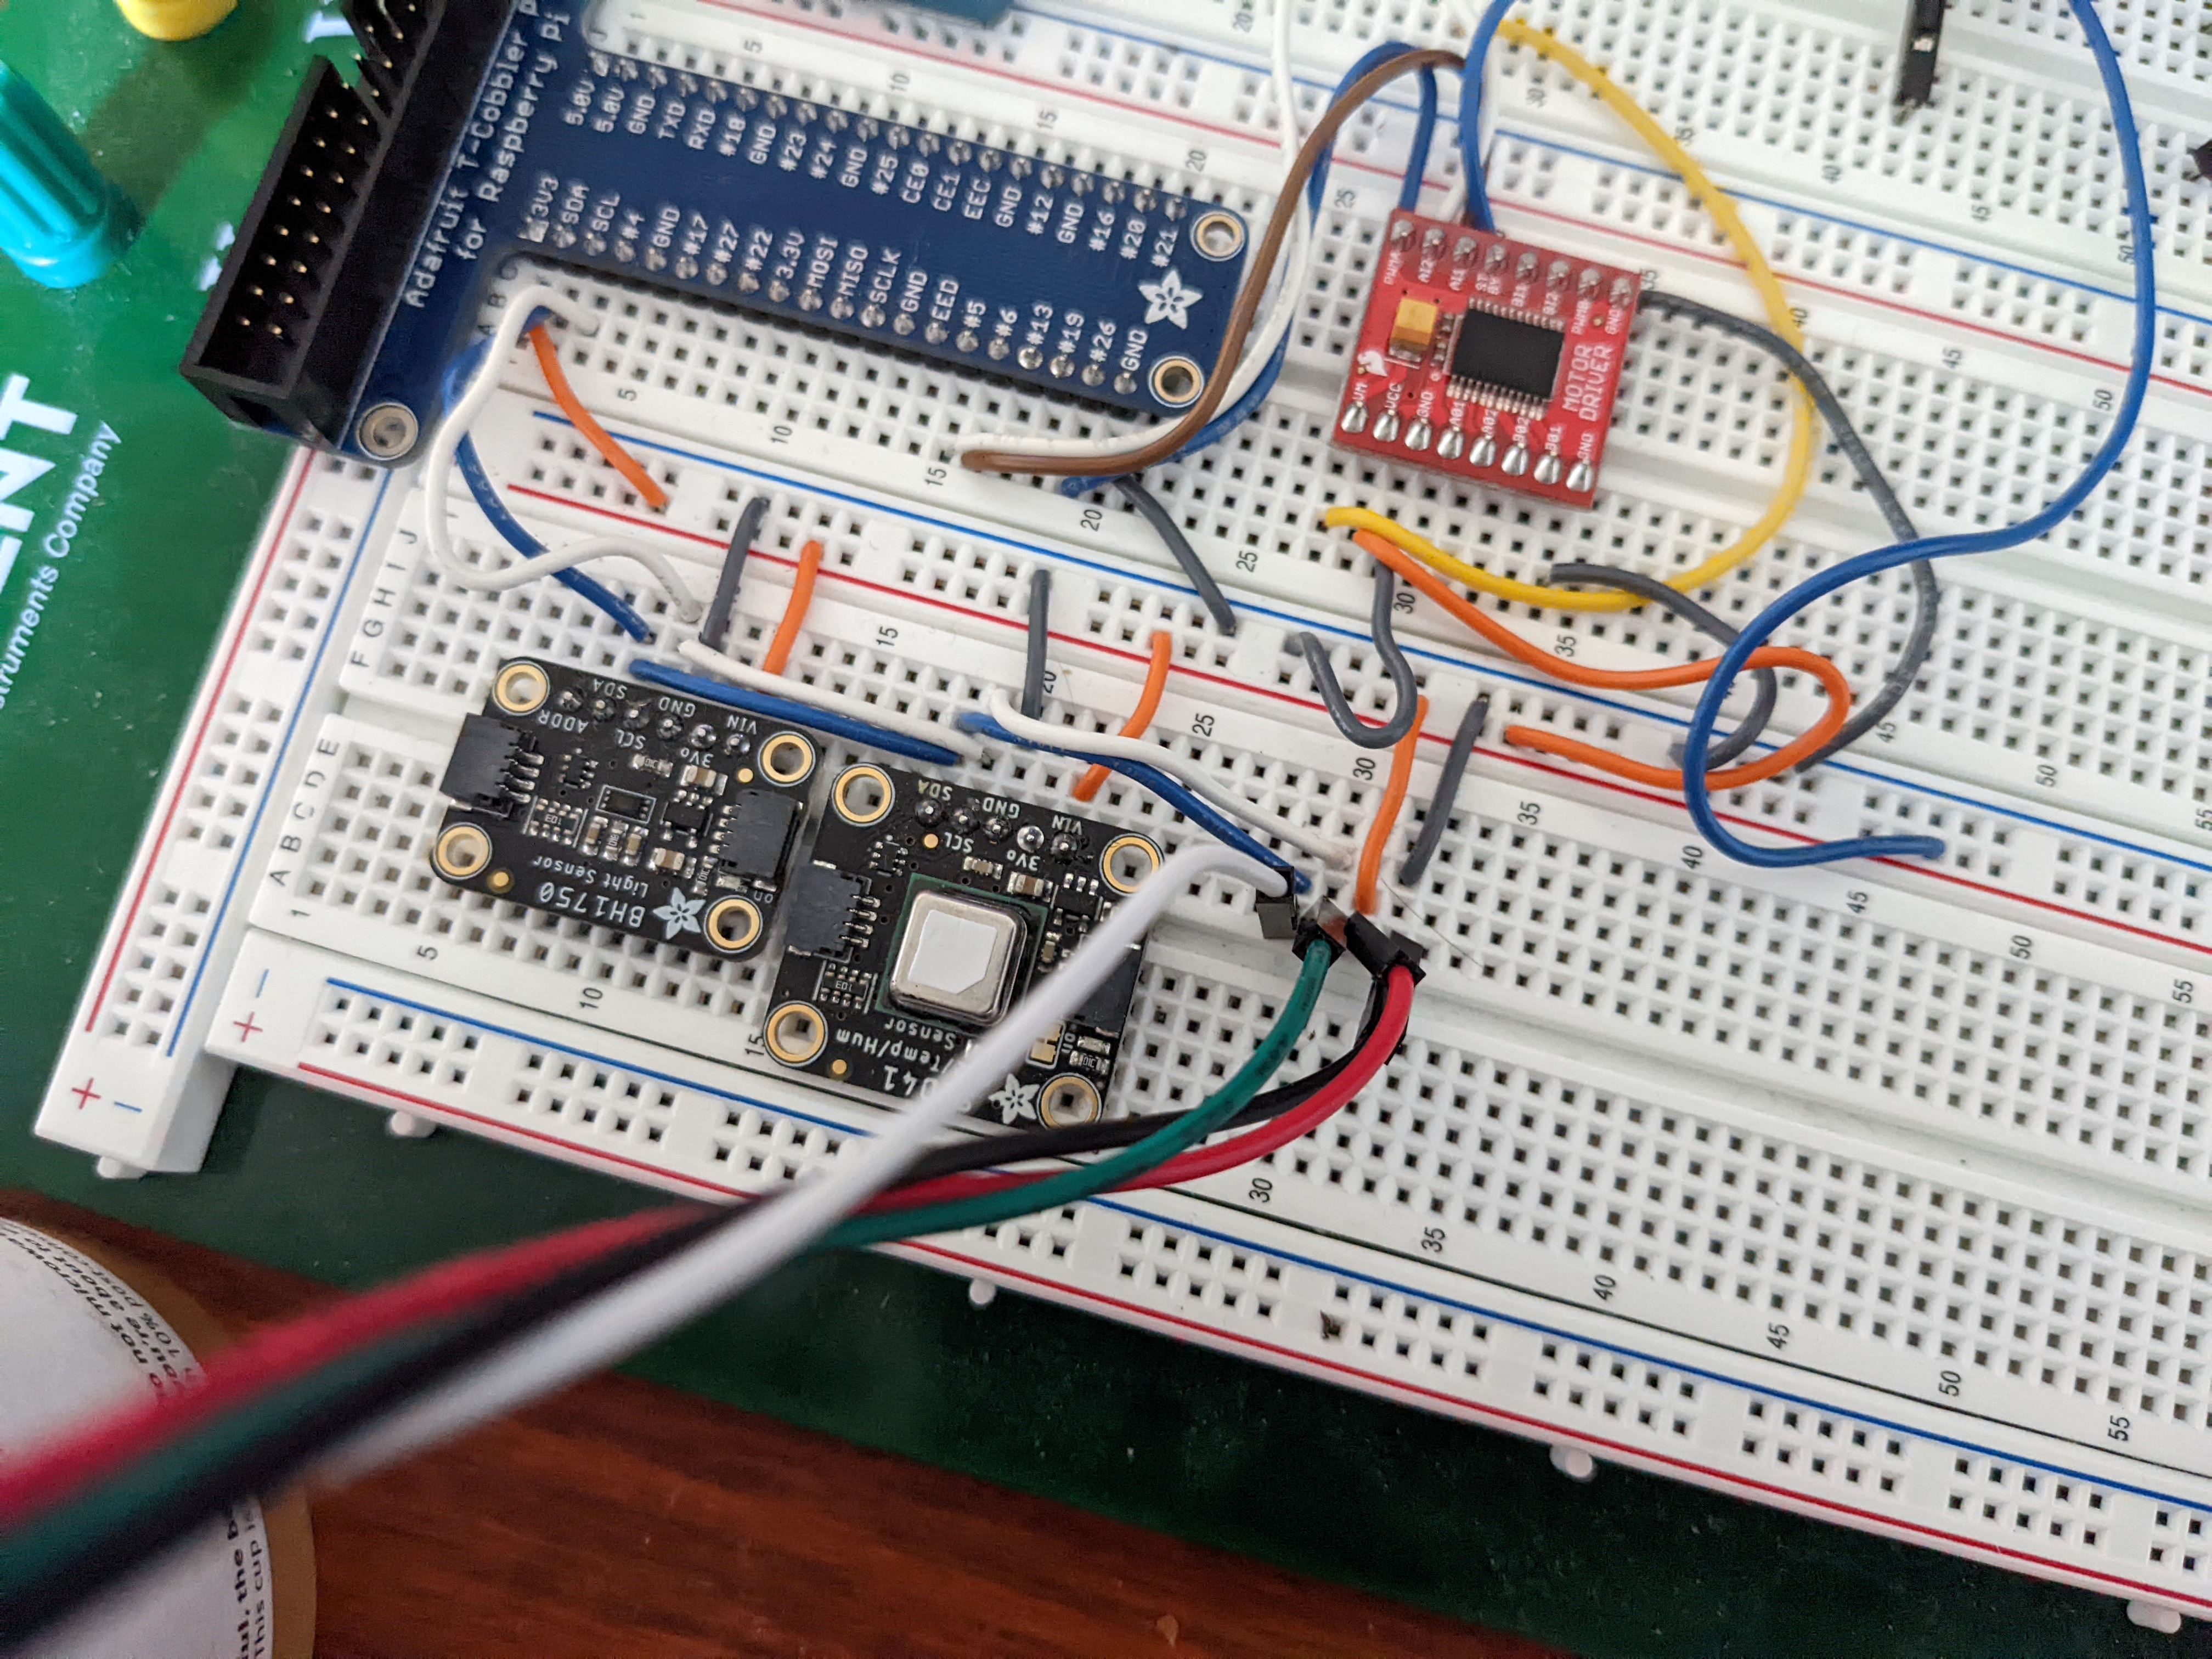
Our system is also able to measure humidity, temperature, light levels, and CO2. These measurements are taken so that the general plant environment can be analyzed by the operator for proper growing conditions. Three of these measurements, temperature, humidity, and CO2, are taken by one sensor, the SCD-40x, which is true CO2 sensor. Many low cost sensors only estimate CO2 based on total VOCs, but this one is able to truly measure CO2. The light levels are provided by the BH1750 which returns a light level in lux. All of the sensors, including the moisture sensor, connect and communicate with the RPi via I2C.
For pumping water, a simple 12V peristaltic pump was used. This allows very precise dosing of water which is important to ensure that the plant does not get overwatered. Other pumps that were tried were inconsistent with the dosing which resulted in either too much or too little water getting dosed.
Software Design:
The sensor and pump program was designed to run continuously in the background. About every second it records all of the measurements from the sensors and adds the result to a csv file with a timestamp. Doing this allows other processes such as the user interface to receive the data and work with while also storing the data longer term in nonvolatile memory. This way if the power goes out the data is still there, and if deeper analysis of the measurements is needed, the csv can easily be read and imported to almost all analysis tools.
After it records all the measurements, it then takes the most recent moisture measurement and applies it to the current running average for moisture. Using a running average helps prevent against a single spurious measurement causing the system to dose water to the plant, making it more robust overall. If the moisture level has fallen below the cutoff, the pump is turned on for a short length of time to dose some water. The program will then continue taking measurements, and after a timeout period has elapsed, will determine if another dose of water is needed. This timeout behavior gives the water time to soak into the soil evenly and allow the moisture reading to settle, avoiding a situation where the lag between water input and moisture reading makes the pump dose far more water than it should, overshooting the desired soil moisture level.
The various settings that the system runs on such as pump speed, dosing length, and dosing interval, are all stored in a settings.json file on the RPi. The program would regularly read from the file and update the settings in the program if they changed. This allows changing of the settings mid program. Just ssh into the RPi, change the setting in the JSON, save it, and then in a few seconds the program will read it, and update its internal settings. Since you do this via ssh you can even do this completely remotely if you needed to.
Testing and Calibration:
To calibrate the moisture sensor, first it was placed into dry soil where a baseline reading of 330 was returned. After that it was placed into very wet soil that is too wet where the sensor measured 700. Finally, it was placed into correctly watered soil and returned a value right around 600. Using these calibration numbers, a cutoff value of 600 was selected to match proper soil moisture.
The capacitive sensor also has some other quirks that caused spurious readings. If you got too close to it with your hands, or touched the soil with your hand, the reading would jump up to 1015. Capacitance is an odd thing, and I found no way to fix this, so any measurements that ended up above 800 were thrown out since those fall well outside of the normal measurement range of soil. This cleaned up the measurements and if the plant wasn’t handled too often resulted in stable measurements.
The CO2 sensor was calibrated two ways. First it was placed outside in the atmosphere where the known CO2 value is about 400ppm. Then the sensors internal auto calibration was turned on so it could calibrate to known standard. The temperature, humidity, and light levels were all left as is. The overall requirement was a measurement within 5% of true value, and the sensors were all rated to reach that out of the box, so no adjustments were made.
The water pump was tested to see if it functioned well as a pump. This is where issues with the original centrifugal pump were found. After switching to a peristaltic, the dosing amounts per second of on-time were very repeatable and by just setting the pump to run for some amount of time, say 3 seconds, produced almost the same amount of water every time. And with the design of the system to redose water if needed, the exact amount of water pumped had no need to be precise, so it was simply set to 3 seconds which seemed appropriate for our size of plant cup.
User Interface:
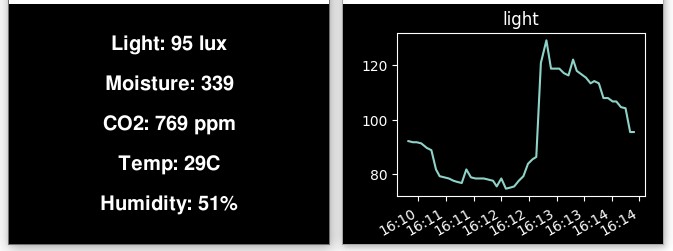
The user interface is run on the PiTFT. No additional buttons or things are needed, just the display screen and the touch digitizer. The user interface program reads from the data csv that the sensor program saves, and then it displays that data to the user. On the main screen it simply displays the most recent measurement result from all the different sensors. By tapping on either the left or right side of the screen, you can then cycle through plots of the various measurements so you can see how measurements have changed over time. Since the system is designed to run continuously, the plots only show the last hour of measurements, but this could be changed by utilizing the settings.json file to set a different timespan. The function which plots the data utilizes two popular python modules for data science, pandas, and matplotlib. Pandas is used to read from the csv file
 |
|---|
| Figure 5: The main screen (left) gives the last measurement values of the sensors. The plots (right) show the logged data over the last hour. |
Remote connection:
Livestream:
For the livestream, we needed to use a Raspberry Pi camera connected
to our system to stream its image online. The camera was configured
using raspi-config, were in the Interface settings, the camera could be
enabled. To ensure the functionality of the camera, we used raspistill
-o image.jpg from the terminal to take stills, and then using the python
library picamera using the preview function to see what the camera was
seeing and how fast the camera refreshes. When the camera was working,
we used the tutorial posted on the following website
to get a stream working (Thanks you Go2Class4Me team for posting this
tutorial on your website!). The website made would be accessed using
http://
Timelaspse:
The timelapse was tricky because the camera does not like to be used for two actions seperately. The camera can only be used to take an image, take a video, or to livestream exclusively. To get around this, we used the subprocesses library in Python. This allows us to start a program as a subprocess and terminate it when necessary. Using this, we added the time library to the process to check the current time. When a specified amount of time has elapsed, the livestream is shut down. The camera then takes a still and saves that to a designated folder. The livestream is then restarted and the user needs to reload the page to continue watching the stream. To make this process easier on the user, a reload button was added to the webpage. Using the input tag with HTML, we edited the page to include a button on the page. The button reads "Reload", and when pressed, sends a signal to the Pi confirming this action. Pressing the button also causes the webpage to be loaded to a secondary one where it registers that the button has been pressed, however this also causes the page to not load as it does not exist. To deal with this problem, in our StreamingHandler class included in our livestream function, we added an extra check to see if the button had been pressed. The check then loads all the same information that would be loaded normally, allowing for the button to be pressed and actually reloading the page. The timelapse is made using a python function that takes images and places the images into a video file. The video is instantiated using OpenCV, setting the video to be 2 frames per second and uses the size of the image to determine the video resolution. The images are then read and sorted by their numerical value into a numpy array. This is necessary because if the images are not sorted beforehand, the video sort the images based on size which may not be in numerical order. The array is then used to write the images into the video, and the video is released. One may ask why the timelapse doesn't just add the latest image to the end of the already made video. This is because OpenCV does not allow for a video to be read and to simply add frames to the end of the video. Therefore, the python program overwrites the previous version of the timelapse and all the picture necessary for the timelapse need to be stored, which will lead to storage issues in the future.
GitHub Pages:
To allow for more ease of user for the user, we also made a webpage using GitHub pages that would allow the user to connect to the livestream more easily. To keep the webpage updates from interfering with the updates to our code, we also made sure to make a secondary branch responsible for the webpage. To access the branch, we cloned the branch into its own folder using git clone -b (branch-name) --single-branch (github url). This made it much easier to modify files within that branch cluttering the rest of our GitHub with unnecessary updates, which would have made it harder to revert course if an error occurred. The page needed to include a link to our livestream so that on the off-chance that the IP address of our Raspberry Pi were to change, the webpage would still lead to the livestream. To do this, we used the socket library as used by our livestream process to determine our current IP address when the stream is started. This IP address is checked against the current IP address stored in the index.html file used by our webpage. If the IP addresses do not match, the system will update the index file to match our current IP. Then the new address is uploaded to the GitHub, where the user can then access the livestream. The webpage also allows the user to see the current timelapse of the plant. This is done by simply uploading the video of the timelapse to the GitHub and calling on the video from the webpage. However, because of a blunder on our part, the system had numerous conflicts with GitHub, which are preventing the timelaspe from being uploaded, so it does not currently show on our webpage. We have confirmed that our function to upload the file to GitHub is functional, so assuming someone sets up their Raspberry Pi to correctly access the repository and do not have any conflicts, they should have no issue uploading the timelapse to the site.
Results and Conclusions:
This is the first prototype of this system, and it is fully capable of keeping the plants alive. The required sensors were calibrated and were able to measure the plant conditions for over 24 hours. The pumps are able to effectively dose water when the soil dries out, and the user interface functions well to give people the information they want to know about their plant. There are of course improvements that can be made for future iterations. A small greenhouse like structure can be used to contain the plants in a more controlled environment. This would give greater purpose to the other sensor readings that are being taken since they could be used to help control the environment a bit. Instead of a 12V pump, it is possible to get a 5V version of the peristaltic pump which would allow the entire supply to run off a single USB power source, rather than the dual 12V-5V source that is currently needed. However overall the system does run as it was designed and is successful.
Code and Repo:
To view the code for this project, check out the repo here!